Abstract
Background: Elevated immature granulocyte (IG) counts indicate bone marrow stress hematopoiesis and may reflect disease progression and poor prognosis. With the widespread use of automated hematology analyzers, the routine measurement of IG percentage (IG%) has become clinically accessible. Although the potential value of IG% in assessing the prognosis of severe infections and sepsis has garnered attention, large-scale studies remain limited. This study aimed to investigate the independent association between IG% at intensive care unit (ICU) admission and short- and long term mortality in patients with sepsis.
Methods: This retrospective cohort study extracted data from the Medical Information Mart for Intensive Care IV (MIMIC-IV, version 3.1) database. Patients with sepsis were categorized into four groups (Q1–Q4) based on the quartiles of their first IG% measurement upon ICU admission. The primary endpoints were 30-day, 60-day, and 90-day all-cause mortality. Survival curves were generated using the Kaplan-Meier method and compared via the Log-rank test. Univariate and multivariate Cox proportional hazards models were utilized to calculate hazard ratios (HRs) and 95% confidence intervals (CIs) to evaluate the independent association between IG% and clinical outcomes. Furthermore, restricted cubic spline (RCS) models were employed to analyze the potential non-linear dose-response relationship between IG% and mortality risk, followed by multivariate subgroup analyses to verify the robustness of the results.
Results: The study included 4,611 patients with sepsis meeting the Sepsis-3.0 criteria. The overall in-hospital and ICU mortality rates were 17% and 13%, respectively. Multivariate Cox regression analysis demonstrated that, after adjusting for potential confounders, an elevated IG% was an independent predictor of increased mortality risk at 30 days (HR 1.35, 95% CI 1.26–1.45, P < 0.001), 60 days (HR 1.31, 95% CI 1.23 1.40, P < 0.001), and 90 days (HR 1.30, 95% CI 1.22–1.39, P < 0.001). The RCS models revealed a significant linear positive correlation between IG% and mortality risk at all time points (P for non-linearity > 0.05). Subgroup analyses confirmed that the association between elevated IG% and increased mortality risk remained highly consistent across different ages, severity of organ failure, and comorbidities.
Conclusions: A high IG% at ICU admission is independently associated with a significantly increased risk of short- and long-term mortality in patients with sepsis. As a rapid, easily accessible, and cost-free parameter from routine complete blood counts, IG% serves as a reliable biomarker for early risk stratification. Identifying patients with elevated IG% (>3%) upon admission may prompt clinicians to initiate closer hemodynamic monitoring and more aggressive source control strategies to mitigate adverse outcomes. Keywords: Immature Granulocyte Percentage; Prognostic Value; Sepsis; Intensive Care Unit; MIMIC-IV Database; Biomarker
Abbreviations: IG: Immature Granulocytes; IG%: Immature Granulocyte percentage; ICU: Intensive Care Unit; MIMIC-IV: Medical Information Mart for Intensive Care IV; HR: Hazard Ratio; CI: Confidence Interval; RCS: Restricted Cubic Spline; SOFA: Sequential Organ Failure Assessment; GCS: Glasgow Coma Scale; CCI: Charlson Comorbidity Index; PCT: Procalcitonin; CRP: C-reactive Protein; CBC: Complete Blood Count; WBC: White Blood Cell; AKI: Acute Kidney Injury; BUN: Blood Urea Nitrogen; INR: International Normalized Ratio; PT: Prothrombin Time; MV: Mechanical Ventilation; CRRT: Continuous Renal Replacement Therapy; MODS: Multiple Organ Dysfunction Syndrome; SIRS: Systemic Inflammatory Response Syndrome; ROS: Reactive Oxygen Species; NETs: Neutrophil Extracellular Traps; G-CSF: Granulocyte colony-stimulating Factor; GM-CSF: Granulocyte-macrophage Colony-stimulating Factor; DIC: Disseminated Intravascular Coagulation; BMI: Body Mass Index; ANOVA: Analysis of Variance; IQR: Interquartile Range; APC: Article Processing Charge.
BACKGROUND
Sepsis is defined as life-threatening organ dysfunction caused by a dysregulated host response to infection [1]. Despite substantial advancements in modern intensive care medicine and antimicrobial therapies, sepsis remains a leading cause of morbidity and mortality among patients in the intensive care unit (ICU). Globally, sepsis-related deaths account for approximately 11 million cases annually, representing nearly 20% of all global deaths [2,3]. Over the past decades, clinical interventions for sepsis have been continuously optimized; however, the overall decline in its incidence and mortality has not met expectations [4,5]. Currently utilized single biomarkers in clinical practice, such as procalcitonin (PCT) and C-reactive protein (CRP), exhibit certain limitations in sensitivity and specificity for the early recognition, severity assessment, and prognostic prediction of sepsis [6,7]. Existing scoring systems, such as the Sequential Organ Failure Assessment (SOFA), often reflect established organ hypoperfusion and damage, which may delay timely intervention. Therefore, identifying novel, rapid, accurate, and cost-effective prognostic biomarkers is of critical clinical significance for the early identification of high-risk patients, guiding individualized clinical decisions, and ultimately improving sepsis outcomes.
During severe infections and systemic inflammatory states, the bone marrow is intensely stimulated by inflammatory cytokines (e.g., G-CSF, GM-CSF), which accelerates granulopoiesis and prompts the premature release of incompletely mature granulocyte precursors (including promyelocytes, myelocytes, and metamyelocytes) into the peripheral blood. This pathophysiological process is termed “emergency granulopoiesis” [8]. The appearance of immature granulocytes (IG) in the peripheral blood not only reflects the body’s severe stress response to infection but may also participate in the complex immune dysregulation mechanisms underlying sepsis. Basic and clinical studies have indicated that the massive release of IGs during sepsis is associated with defects in phagocytic and bactericidal functions. Furthermore, these cells may exacerbate endothelial damage through the release of proteolytic enzymes and exhibit an immunosuppressive phenotype (e.g., CD10- CD16-subpopulations) that inhibits T-cell proliferation, thereby driving the progression toward multiple organ dysfunction syndrome (MODS) and poor prognosis [9 11].
With the widespread application of modern automated hematology analyzers (e.g., the Sysmex series), the immature granulocyte percentage (IG%) and absolute count have become routine automatic output parameters of the complete blood count (CBC). These results can be obtained within minutes without the need for additional blood sampling or reagent costs [12]. In recent years, the diagnostic and prognostic value of IG% in various acute inflammatory diseases has gained increasing attention. Studies have found that IG% levels significantly elevate with increasing disease severity in conditions such as acute pancreatitis, acute cholecystitis, and ST-segment elevation myocardial infarction [13-15]. In the field of infectious diseases, IG% demonstrates moderate discriminative ability (AUC approximately 0.71) in distinguishing sepsis from non-infectious systemic inflammatory response syndrome (SIRS) [16]. Moreover, in patients developing sepsis after cardiac surgery, combining IG% with PCT further improves diagnostic specificity [17]. However, findings regarding the relationship between IG% and all-cause mortality in patients with severe sepsis are not entirely consistent. Some studies indicate that IG% serves as an independent risk factor for 30-day mortality in patients with sepsis induced by peritonitis [18]; conversely, other literature reports that while IG% reflects the severity of sepsis complicated by disseminated intravascular coagulation (DIC), its predictive efficacy for 28-day mortality is limited [19]. Additionally, in specific populations such as neonatal sepsis, the diagnostic sensitivity of IG% appears insufficient [20].
Existing data on the prognostic value of IG% predominantly originate from single-center, small sample, or specific surgical population retrospective cohorts, lacking validation across large-scale, diverse critical care populations. Furthermore, potential non linear dose-response relationships between IG% and mortality at various time points (e.g., 30 days, 60 days, 90 days) remain underexplored. Consequently, this study utilized the large, publicly available Medical Information Mart for Intensive Care IV (MIMIC-IV) database to systematically evaluate the independent association between IG% at ICU admission and both short- and long-term mortality risks in patients with sepsis, after comprehensively adjusting for potential confounders. The objective is to provide robust, large sample evidence to support the application of IG% in the clinical risk stratification of sepsis, thereby facilitating early, targeted interventions for high-risk patients.
METHODS
Study Design and Data Source
This retrospective observational cohort study utilized data from the Medical Information Mart for Intensive Care IV (MIMIC-IV, version 3.1) database. The study was reported in accordance with the Strengthening the Reporting of Observational Studies in Epidemiology (STROBE) guidelines. MIMIC-IV is a large, publicly accessible critical care database comprising comprehensive clinical data from over 50,000 ICU admissions at the Beth Israel Deaconess Medical Center (Boston, MA, USA) between 2008 and 2019 [21]. The database encompasses demographic characteristics, vital signs, laboratory tests, medication records, and diagnostic codes based on the International Classification of Diseases, Ninth Revision (ICD-9) and Tenth Revision (ICD-10). The authors obtained access to the database after completing the required certification courses. Because all protected health information (PHI) in the MIMIC-IV database has been strictly de-identified, the requirement for ethical approval and patient informed consent was waived by the Institutional Review Board.
Study Population and Inclusion
The inclusion criteria were based on the Third International Consensus Definitions for Sepsis and Septic Shock (Sepsis-3.0) [1]: (1) adult patients aged ≥ 18 years; (2) presence of suspected or documented infection (based on antibiotic administration and microbiological culture records); and (3) an increase in the Sequential Organ Failure Assessment (SOFA) score of ≥ 2 points from baseline.
The exclusion criteria were as follows: (1) ICU length of stay < 24 hours; (2) for patients with multiple ICU admissions for sepsis, only the data from the first ICU admission were retained; (3) missing data for core variables (e.g., the first IG% measurement upon ICU admission); and (4) long-term use of immunosuppressive agents.
The patient selection process is illustrated in Figure 1.
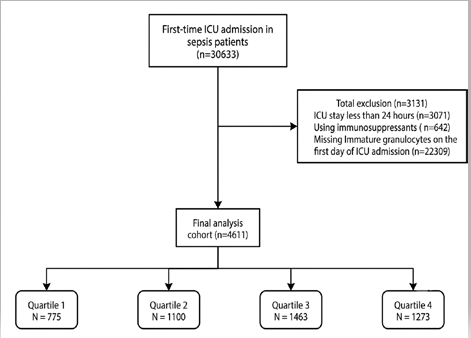
Figure 1: Patient selection flowchart. Flowchart illustrating the patient selection process from the MIMIC-IV database. A total of 30,633 patients with first-time ICU admission for sepsis were initially identified. After applying exclusion criteria (ICU stay < 24 hours, n = 3,071; use of immunosuppressants, n = 642; missing immature granulocyte data on the first day of ICU admission, n = 22,309; total exclusion n = 26,022), a final analysis cohort of 4,611 patients was included and stratified into four quartile groups based on IG% (Q1, n = 775; Q2, n = 1,100; Q3, n = 1,463; Q4, n = 1,273).
Data Extraction and Variable Definition
Data extraction was performed using Navicat Premium 17.0 software via Structured Query Language (SQL) to retrieve clinical and laboratory data within the first 24 hours of ICU admission from the MIMIC IV database. If a variable had multiple recorded values within this 24-hour window, the mean or the worst value was selected based on clinical relevance.
The extracted variables included:
1. Demographic characteristics: Age, sex, race, and body mass index (BMI).
2. Vital signs: Heart rate, respiratory rate, and systolic blood pressure.
3. Laboratory parameters: The first measurement upon ICU admission of IG%, white blood cell (WBC) count, neutrophil count, lymphocyte count, platelet count, hemoglobin, serum creatinine, blood urea nitrogen (BUN), lactate, international normalized ratio (INR), and prothrombin time (PT).
4. Disease severity scores: SOFA score, Glasgow Coma Scale (GCS), and Charlson Comorbidity Index (CCI).
5. Comorbidities: Acute myocardial infarction, congestive heart failure, hypertension, diabetes mellitus, malignancies, and liver cirrhosis.
6. Therapeutic interventions: Use of vasopressors (e.g., norepinephrine), mechanical ventilation (MV), and continuous renal replacement therapy (CRRT).
Clinical Outcomes
The primary outcome measures were 30-day, 60 day, and 90-day all-cause mortality. Secondary outcome measures included in-hospital all-cause mortality and ICU mortality.
Statistical Analysis
The normality of continuous variables was assessed using the Shapiro-Wilk test. Normally distributed continuous variables were expressed as mean ± standard deviation (SD), and intergroup comparisons were performed using one-way analysis of variance (ANOVA). Non-normally distributed continuous variables were presented as median (interquartile range, IQR), and intergroup comparisons were conducted using the Kruskal-Wallis test. Categorical variables were expressed as frequencies and percentages, and the Chi-square (χ²) test or Fisher’s exact test was used for intergroup comparisons. Variables with a missing data rate > 30% were excluded. For the remaining variables with missing values, multiple imputation was applied using the mice package in R.
Patients were divided into quartiles (Q1–Q4) based on their first IG% measurement upon ICU admission. Survival curves for patients in different IG% groups were generated using the Kaplan-Meier method, and survival differences between groups were compared using the Log-rank test. Univariate and multivariate Cox proportional hazards regression models were utilized to evaluate the independent association between IG% (analyzed both as a continuous and a categorical variable) and 30-day, 60-day, and 90 day mortality. The results were expressed as hazard ratios (HRs) and 95% confidence intervals (CIs). In the multivariate models, potential confounders— including age, sex, race, comorbidities, vital signs, and disease severity scores (e.g., SOFA score)—were stepwise adjusted based on their clinical relevance and established literature.
To further explore the potential non-linear relationship between IG% and mortality risk, a restricted cubic spline (RCS) regression model with four knots was employed, adjusting for the aforementioned confounders. Finally, subgroup analyses were conducted based on age, sex, type of organ failure, and major comorbidities to verify the robustness of the results and to assess potential interactions. All statistical analyses were performed using R software (version 4.4.3, www.r-project.org). A two-sided P-value < 0.05 was considered statistically significant.
RESULTS
Baseline Characteristics of the Patients
This study ultimately included 4,611 patients with sepsis meeting the Sepsis-3.0 criteria. Patients were divided into four groups (Q1–Q4) based on their first IG% level upon ICU admission. The overall in-hospital all-cause mortality was 17% (785/4,611), and the ICU mortality was 13% (584/4,611). The baseline characteristics of the study population stratified by IG% quartiles are presented in Table 1.
Table 1: Baseline Characteristics.
|
Characteristic |
Overall N = 4,611 |
Q1 N = 775 |
Q2 N = 1,100 |
Q3 N = 1,463 |
Q4 N = 1,273 |
p-value |
|
Age (year) |
68.03 (57.95, 77.74) |
68.40 (56.29, 78.58) |
68.38 (57.83, 78.64) |
68.15 (59.09, 77.67) |
67.33 (57.72, 76.66) |
0.204 |
|
Gender, n (%) |
0.008 |
|||||
|
Female |
1,841 (40%) |
332 (43%) |
437 (40%) |
536 (37%) |
536 (42%) |
|
|
Male |
2,770 (60%) |
443 (57%) |
663 (60%) |
927 (63%) |
737 (58%) |
|
|
Race, n (%) |
0.002 |
|||||
|
White |
2,974 (64%) |
456 (59%) |
710 (65%) |
979 (67%) |
829 (65%) |
|
|
Other |
1,637 (36%) |
319 (41%) |
390 (35%) |
484 (33%) |
444 (35%) |
|
|
BMI |
28.34 (24.43, 33.08) |
26.78 (23.44, 31.96) |
27.77 (23.89, 32.18) |
28.63 (24.67, 33.13) |
29.29 (25.14, 34.48) |
<0.001 |
|
Heart rate (bmp) |
85.00 (76.00, 101.00) |
84.00 (73.00, 100.00) |
85.00 (76.00, 100.00) |
84.00 (76.00, 99.00) |
88.00 (79.00, 103.00) |
<0.001 |
|
Resp rate (bmp) |
18.00 (16.00, 23.00) |
18.00 (16.00, 22.00) |
18.00 (16.00, 23.00) |
18.00 (15.00, 23.00) |
19.50 (16.00, 25.00) |
<0.001 |
|
SBP (mmHg) |
117.00 (104.00, 134.00) |
121.00 (106.00, 137.00) |
119.00 (104.00, 135.25) |
116.00 (104.00, 132.00) |
116.00 (102.00, 133.00) |
<0.001 |
|
SOFA |
2.00 (0.00, 4.00) |
1.00 (0.00, 3.00) |
2.00 (0.00, 4.00) |
2.00 (1.00, 4.00) |
3.00 (1.00, 5.00) |
<0.001 |
|
GCS |
15.00 (15.00, 15.00) |
15.00 (15.00, 15.00) |
15.00 (15.00, 15.00) |
15.00 (15.00, 15.00) |
15.00 (15.00, 15.00) |
0.016 |
|
CCI |
5.00 (3.00, 7.00) |
5.00 (3.00, 7.00) |
5.00 (3.00, 7.00) |
5.00 (3.00, 7.00) |
5.00 (3.00, 7.00) |
0.119 |
|
Myocardial infarct, n (%) |
1,058 (23%) |
156 (20%) |
254 (23%) |
377 (26%) |
271 (21%) |
0.007 |
|
Congestive heart failure, n (%) |
1,626 (35%) |
247 (32%) |
387 (35%) |
517 (35%) |
475 (37%) |
0.100 |
|
AKI, n (%) |
3,906 (85%) |
637 (82%) |
908 (83%) |
1,238 (85%) |
1,123 (88%) |
<0.001 |
|
Cirrhosis, n (%) |
408 (9%) |
76 (10%) |
94 (9%) |
104 (7%) |
134 (11%) |
0.012 |
|
Malignant cancer, n (%) |
464 (10%) |
60 (8%) |
86 (8%) |
145 (10%) |
173 (14%) |
<0.001 |
|
Diabetes, n (%) |
1,507 (33%) |
253 (33%) |
351 (32%) |
484 (33%) |
419 (33%) |
0.932 |
|
Hypertension, n (%) |
3,195 (69%) |
500 (65%) |
771 (70%) |
1,060 (72%) |
864 (68%) |
<0.001 |
|
RBC (109/L) |
3.45 (2.88, 4.09) |
3.69 (3.14, 4.33) |
3.57 (3.00, 4.20) |
3.38 (2.82, 4.03) |
3.30 (2.77, 3.90) |
<0.001 |
|
WBC (109/L) |
12.00 (8.70, 16.30) |
9.40 (6.90, 11.90) |
11.10 (8.30, 14.40) |
12.80 (9.40, 17.00) |
14.80 (10.10, 20.40) |
<0.001 |
|
Platelet (109/L) |
172.00 (123.00, 241.00) |
177.00 (120.00, 234.00) |
172.00 (123.00, 233.50) |
166.00 (121.00, 240.00) |
178.00 (123.00, 264.00) |
0.018 |
|
Hemoglobin (g/dL) |
10.30 (8.60, 12.00) |
11.10 (9.40, 12.80) |
10.50 (8.95, 12.30) |
10.10 (8.40, 11.90) |
9.70 (8.30, 11.40) |
<0.001 |
|
Neutrophils (109/L) |
9.76 (6.71, 13.80) |
7.07 (4.79, 9.37) |
8.99 (6.44, 11.96) |
10.57 (7.53, 14.26) |
12.41 (8.12, 17.36) |
<0.001 |
|
Lymphocytes (109/L) |
1.21 (0.74, 1.89) |
1.18 (0.72, 1.78) |
1.20 (0.76, 1.82) |
1.30 (0.77, 1.99) |
1.13 (0.69, 1.88) |
0.001 |
|
Immature granulocytes (109/L) |
0.70 (0.50, 1.10) |
0.40 (0.30, 0.40) |
0.55 (0.50, 0.60) |
0.80 (0.70, 0.90) |
1.50 (1.20, 2.00) |
<0.001 |
|
Sodium (mmol/L) |
138.00 (136.00, 141.00) |
139.00 (136.00, 142.00) |
138.00 (136.00, 141.00) |
138.00 (136.00, 141.00) |
138.00 (135.00, 141.00) |
<0.001 |
|
Potassium (mmol/L) |
4.20 (3.90, 4.70) |
4.10 (3.80, 4.60) |
4.20 (3.85, 4.60) |
4.30 (3.90, 4.70) |
4.30 (3.90, 4.80) |
<0.001 |
|
BUN (mg/dL) |
20.00 (14.00, 33.00) |
18.00 (12.00, 29.00) |
18.00 (13.00, 30.50) |
19.00 (14.00, 31.00) |
24.00 (16.00, 41.00) |
<0.001 |
|
Creatinine (mg/dL) |
1.00 (0.80, 1.60) |
1.00 (0.70, 1.40) |
1.00 (0.70, 1.40) |
1.00 (0.80, 1.60) |
1.20 (0.80, 1.90) |
<0.001 |
|
Characteristic |
Overall N = 4,611 |
Q1 N = 775 |
Q2 N = 1,100 |
Q3 N = 1,463 |
Q4 N = 1,273 |
p-value |
|
INR |
1.30 (1.20, 1.60) |
1.20 (1.10, 1.50) |
1.30 (1.10, 1.50) |
1.40 (1.20, 1.60) |
1.40 (1.20, 1.70) |
<0.001 |
|
PT (S) |
14.50 (12.70, 17.30) |
13.40 (12.10, 16.00) |
14.20 (12.40, 16.90) |
14.90 (13.00, 17.30) |
15.10 (13.10, 18.50) |
<0.001 |
|
PTT (S) |
30.80 (27.20, 37.40) |
30.20 (27.00, 36.00) |
30.90 (27.20, 37.65) |
30.70 (27.20, 37.50) |
31.20 (27.40, 38.10) |
0.105 |
|
Norepinephrine, n (%) |
1,638 (36%) |
217 (28%) |
349 (32%) |
502 (34%) |
570 (45%) |
<0.001 |
|
MV, n (%) |
4,101 (89%) |
654 (84%) |
976 (89%) |
1,328 (91%) |
1,143 (90%) |
<0.001 |
|
CRRT, n (%) |
377 (8%) |
31 (4%) |
62 (6%) |
111 (8%) |
173 (14%) |
<0.001 |
|
Urine output (ml) |
1,480.00 (880.00, 2,250.00) |
1,535.00 (910.00, 2,355.00) |
1,582.50 (949.50, 2,304.00) |
1,475.00 (875.00, 2,240.00) |
1,355.00 (760.00, 2,150.00) |
<0.001 |
|
Los hospital (day) |
9.60 (5.92, 17.37) |
9.68 (5.96, 17.45) |
9.12 (5.94, 16.65) |
8.91 (5.69, 16.49) |
10.52 (6.12, 19.76) |
<0.001 |
|
Hospital Mortality, n (%) |
785 (17%) |
88 (11%) |
158 (14%) |
230 (16%) |
309 (24%) |
<0.001 |
|
Los ICU (day) |
3.37 (1.86, 7.24) |
3.44 (1.87, 6.95) |
3.23 (1.78, 7.01) |
3.16 (1.74, 6.65) |
3.84 (2.03, 8.25) |
<0.001 |
|
ICU Mortality, n (%) |
584 (13%) |
61 (8%) |
111 (10%) |
167 (11%) |
245 (19%) |
<0.001 |
|
30-day hospital Mortality , n (%) |
920 (20%) |
112 (14%) |
199 (18%) |
266 (18%) |
343 (27%) |
<0.001 |
|
60-day hospital Mortality , n (%) |
1,109 (24%) |
154 (20%) |
240 (22%) |
312 (21%) |
403 (32%) |
<0.001 |
|
90-day hospital Mortality , n (%) |
1,213 (26%) |
169 (22%) |
262 (24%) |
351 (24%) |
431 (34%) |
<0.001 |
|
Immature granulocytes: Q1 (0.10-0.50), Q2(0.50-0.70), Q3(0.70-1.10),Q4(1.10-2.70) ,SOFA: Sequential organ failure assessment, GCS: Glasgow Coma Scale, CCI: Charlson Comorbidity Index, SpO2: Oxygen saturation, SBP: Systolic blood pressure, WBC: White blood cell count, RBC: Red blood cell count, Platelet: Platelet count, AKI: Acute kidney injury, INR: International normalized ratio, MV: Mechanical Ventilation, CRRT: Continuous renal replacement therapy. |
||||||
Patients in the highest IG% quartile (Q4) exhibited a more severe clinical status. As IG% increased, the WBC count and neutrophil count significantly elevated (P < 0.001). The degree of organ dysfunction worsened, evidenced by higher SOFA scores (P < 0.001), a higher incidence of acute kidney injury (AKI) (88% in Q4 vs. 82% in Q1, P < 0.001), and significantly elevated serum creatinine levels. Furthermore, the demand for intensive care interventions was markedly higher in the Q4 group, including the use of norepinephrine (45% vs. 28%), mechanical ventilation (90% vs. 84%), and CRRT (14% vs. 4%), all of which were significantly higher than in the Q1 group (all P < 0.001). Regarding clinical outcomes, both ICU mortality (19% in Q4 vs. 8% in Q1) and 30-day in-hospital mortality (27% in Q4 vs. 14% in Q1) showed a significant gradient increase with rising IG% quartiles (all P < 0.001).
Independent Association between IG% and Sepsis Mortality
The results of the multivariate Cox proportional hazards models demonstrated that, even after comprehensive adjustment for demographic characteristics, comorbidities, and disease severity scores, IG% remained a significant independent predictor of mortality at all assessed time points (Table 2). When analyzed as a continuous variable, each one-unit increase in IG% was associated with a significantly increased 30-day mortality risk (HR 1.35, 95% CI 1.26–1.45, P < 0.001); similarly, the 60-day and 90-day mortality risks also increased (HR 1.31, P < 0.001; HR 1.30, P < 0.001, respectively).
Table 2: Independent Association between IG% and Sepsis Mortality
|
Variables |
Model1 |
Model2 |
Model3 |
|||
|
HR (95%CI) |
P |
HR (95%CI) |
P |
HR (95%CI) |
P |
|
|
d-30 |
||||||
|
I m m a t u r e granulocytes |
1.38(1.29~ 1.47) |
<.001 |
1.36(1.27~ 1.45) |
<.001 |
1.35(1.26~1.45) |
<.001 |
|
I m m a t u r e g r a n u l o c y t e s group |
||||||
|
Q1 |
1.00 (Reference) |
1.00(Reference) |
1.00(Reference) |
|||
|
Q2 |
1.27(1.01~ 1.60) |
0.044 |
1.31(1.04~1.65) |
0.022 |
1.29(1.02~1.63) |
0.033 |
|
Q3 |
1.29(1.03~ 1.60) |
0.025 |
1.34(1.07~1.67) |
0.011 |
1.28(1.02~1.60) |
0.031 |
|
Q4 |
2.03 (1.64 ~ 2.51) |
<.001 |
2.05 (1.65~2.54) |
<.001 |
1.92(1.54~2.39) |
<.001 |
|
d-60 |
||||||
|
I m m a t u r e granulocytes |
1.34 (1.26 ~ 1.43) |
<.001 |
1.33(1.24 ~1.41) |
<.001 |
1.31(1.23~1.40) |
<.001 |
|
I m m a t u r e g r a n u l o c y t e s group |
||||||
|
Q1 |
1.00 (Reference) |
1.00(Reference) |
1.00(Reference) |
|||
|
Q2 |
1.12 (0.91 ~ 1.37) |
0.287 |
1.16(0.94~ 1.41) |
0.164 |
1.14(0.93~1.39) |
0.218 |
|
Q3 |
1.10 (0.91 ~ 1.33) |
0.336 |
1.14(0.94~ 1.39) |
0.184 |
1.09(0.90~1.33) |
0.385 |
|
Q4 |
1.75 (1.46 ~ 2.11) |
<.001 |
1.77(1.47 ~2.13) |
<.001 |
1.66(1.37~2.00) |
<.001 |
|
d-90 |
||||||
|
I m m a t u r e granulocytes |
1.33 (1.25 ~ 1.41) |
<.001 |
1.31(1.23~ 1.40) |
<.001 |
1.30(1.22~1.39) |
<.001 |
|
I m m a t u r e g r a n u l o c y t e s group |
||||||
|
Q1 |
1.00 (Reference) |
1.00(Reference) |
1.00(Reference) |
|||
|
Q2 |
1.11 (0.92 ~ 1.35) |
0.284 |
1.15(0.95~ 1.40) |
0.152 |
1.13(0.93~1.38) |
0.207 |
|
Q3 |
1.13 (0.94 ~ 1.35) |
0.201 |
1.17(0.97~ 1.41) |
0.093 |
1.12(0.93~1.35) |
0.240 |
|
Q4 |
1.72 (1.44 ~ 2.05) |
<.001 |
1.74(1.45~ 2.08) |
<.001 |
1.62(1.35~1.95) |
<.001 |
When IG% was analyzed as a categorical variable using the Q1 group as the reference, the increase in mortality risk was most pronounced in the Q4 group. In the fully adjusted model (Model 3), the 30-day mortality risk in the Q4 group nearly doubled (HR 1.92, 95% CI 1.54–2.39, P < 0.001), and the 60-day and 90-day mortality risks were also significantly elevated (HR 1.66, 95% CI 1.37–2.00, P < 0.001; HR 1.62, 95% CI 1.35–1.95, P < 0.001, respectively).
Survival Analysis and Evaluation of Non-linear Relationships
Kaplan-Meier survival curves visually depicted the differences in survival probabilities among the four IG% stratified groups at 30, 60, and 90 days (Figure 2). The Log-rank test indicated highly statistically significant differences in survival rates among the groups (P < 0.001). The Q1 group had the highest survival probability, whereas the Q4 group exhibited the lowest and most rapidly declining survival probability, further confirming the strong association between high IG% levels and poor prognosis.
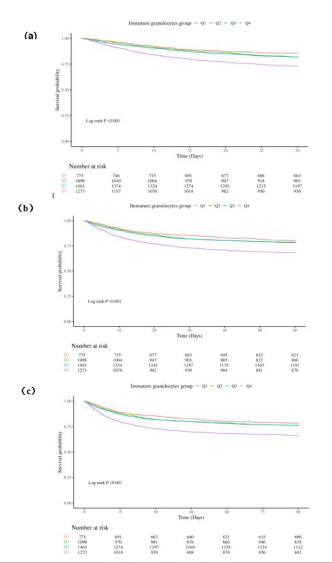
Figure 2: Kaplan-Meier survival curves stratified by IG% quartiles. Kaplan-Meier survival curves depicting the survival probabilities of patients with sepsis stratified by immature granulocyte percentage (IG%) quartiles (Q1–Q4) at (a) 30 days, (b) 60 days, and (c) 90 days. The number at risk is displayed below each panel. The Q4 group (highest IG%) consistently demonstrated the lowest survival probability across all time points. Log-rank P < 0.001 for all comparisons.
The multivariate-adjusted restricted cubic spline (RCS) analysis revealed a significant linear positive correlation between IG% and mortality rates at 30, 60, and 90 days (overall P < 0.001; P for non-linearity > 0.05) (Figure 3). The threshold for a significant increase in risk emerged when IG% reached approximately 2%–3%, indicating that IG% is a stable and reliable continuous risk marker suitable for dynamic risk stratification in critically ill patients.
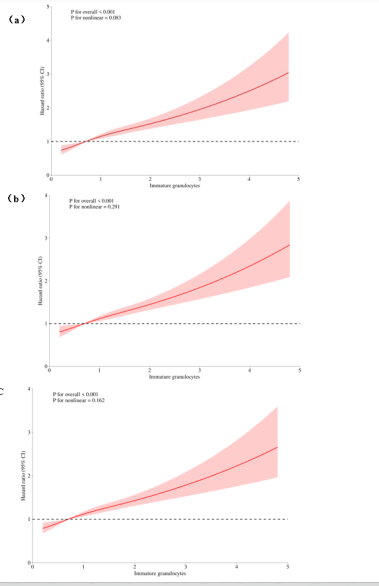
Figure 3: Restricted cubic spline analysis of IG% and mortality. Restricted cubic spline (RCS) regression curves illustrating the adjusted dose-response relationship between immature granulocyte percentage (IG%) and the hazard ratio for (a) 30-day, (b) 60-day, and (c) 90-day all-cause mortality. The solid red line represents the estimated HR, and the shaded pink area represents the 95% confidence interval. The dashed horizontal line indicates HR = 1.0 (reference). A significant linear positive association was observed at all time points (P for overall < 0.001; P for non-linearity > 0.05), with the risk inflection point emerging at approximately IG% 2%–3%.
Subgroup Analyses
To verify the robustness of the results, the association between elevated IG% and mortality risk was evaluated across multiple clinical subgroups (Figure 4). The forest plot results demonstrated that in the vast majority of subgroups, an elevated IG% was significantly associated with an increase in mortality (all P < 0.05). More importantly, the patient’s age, sex, type of organ failure, and comorbidity status did not exert a significant interaction on this association (P for interaction > 0.05 in the majority of subgroups). This underscores the independence of IG% as a prognostic marker in sepsis.
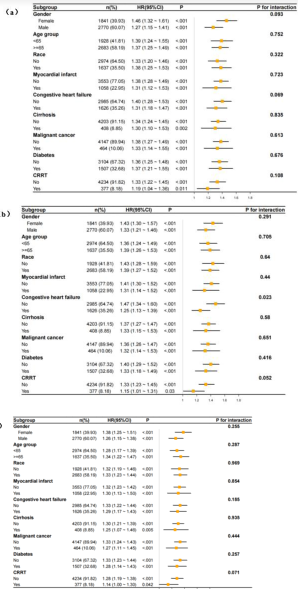
Figure 4: Subgroup analyses (forest plots). Forest plots showing the association between immature granulocyte percentage (IG%) and all-cause mortality across predefined clinical subgroups at (a) 30 days, (b) 60 days, and (c) 90 days. Hazard ratios (squares) and 95% confidence intervals (horizontal lines) are presented for each subgroup. P for interaction values are displayed on the right. No significant interactions were observed in the majority of subgroups, confirming the robustness and consistency of the prognostic association.
DISCUSSION
Principal Findings and Clinical Implications
Early risk stratification and prognostic evaluation of sepsis remain major challenges in critical care medicine. This study, based on the large public MIMIC IV database, systematically evaluated the prognostic value of the peripheral blood immature granulocyte percentage (IG%) in patients with sepsis. The results clearly demonstrate that an elevated IG% upon ICU admission is independently and significantly associated with an increased risk of 30-day, 60-day, and 90-day all-cause mortality. The restricted cubic spline (RCS) analysis further confirmed a stable linear dose response relationship between IG% and mortality risk. These findings establish IG% as an effective clinical biomarker reflecting sepsis severity and predicting adverse outcomes.
Importantly, this study highlights the direct clinical actionability of IG% in ICU practice. For patients presenting with an IG% > 3% upon admission, clinicians should be alerted to a significantly higher risk of deterioration. This readily available parameter can prompt intensivists to initiate closer hemodynamic monitoring, escalate life support earlier, or pursue a more aggressive search for occult sources of infection, thereby directly influencing the clinical decision making process.
Potential Mechanisms: Emergency Granulopoiesis and Immunosuppression
During the pathophysiology of sepsis, a robust systemic inflammatory response—particularly the massive release of bacterial toxins and inflammatory cytokines—rapidly stimulates the bone marrow to secrete granulocyte colony-stimulating factor (G-CSF) and granulocyte-macrophage colony-stimulating factor (GM-CSF) [22]. This intense stimulation triggers “emergency granulopoiesis,” causing granulocyte precursors, which normally require 7–10 days to mature, to be prematurely released into the bloodstream, resulting in a marked elevation of peripheral IG [8].
However, these compensatory, prematurely released immature granulocytes often exhibit functional defects. Compared to mature neutrophils, IGs have significantly reduced chemotactic, phagocytic, and bactericidal capacities, and their ability to produce reactive oxygen species (ROS) and release neutrophil extracellular traps (NETs) upon pathogen stimulation is limited [8]. Furthermore, the massive influx of IGs into the circulation may release proteolytic enzymes, such as elastase, which directly attack vascular endothelial cells. This leads to capillary leak, tissue edema, and microcirculatory dysfunction, key events driving the development of sepsis-related multiple organ dysfunction syndrome (MODS) [9].
More compellingly, recent single-cell multi-omics and flow cytometry studies have revealed that the expanded IG populations in patients with sepsis (particularly low-density neutrophil subpopulations) often exhibit an “immunosuppressive” phenotype. For instance, IGs expressing low levels of CD16 and CD10 (CD16- CD10-) are not only closely associated with lymphopenia but can also directly inhibit the proliferation and function of CD4+ T cells [10-23]. The abundance of these functionally impaired and immunosuppressive IGs signifies that the patient’s overall immune system has entered a state of “functional immunosuppression,” severely compromising the body’s defense against secondary or opportunistic infections. This provides a crucial mechanistic explanation for the strong association between a high IG% and high mortality observed in this study.
The Incremental Prognostic Value of IG%
The conclusions of this study are highly consistent with multiple reports exploring the clinical value of IG. Previous studies have shown that in distinguishing between infectious and non-infectious states, the diagnostic performance of IG% is superior to that of the traditional white blood cell (WBC) count and absolute neutrophil count (ANC), demonstrating higher specificity [16]. In predicting critical care prognosis, IG% correlates significantly with classic disease severity scores such as SOFA and APACHE II [24], and a high proportion of CD16- IGs can effectively predict clinical deterioration within 48 hours in patients with sepsis [23]. By utilizing a large dataset, this study further confirms the independent predictive value of IG% for both short-term and medium-to-long term (90-day) mortality, addressing the limitations of previous studies that were mostly confined to 28-day or 30-day outcomes.
It is worth emphasizing that IG% possesses unique incremental information value and temporal advantages compared to existing clinical markers. First, studies indicate that IG% can significantly elevate within the first 24 to 48 hours after the onset of systemic inflammatory response syndrome (SIRS), providing an early warning of infectious deterioration even before clinical symptoms fully manifest [25]. Second, although the SOFA score and lactate levels are currently recognized as prognostic gold standards, they often reflect organ hypoperfusion and irreversible organ damage that have already occurred [26]. In the multivariate Cox models of this study, IG% maintained a significant independent predictive value (HR 1.35) even after adjusting for the SOFA score, lactate, and comorbidities. This suggests that the bone marrow immune stress state reflected by IG% is independent of hemodynamic derangements (lactate) and end-organ failure (SOFA), providing additional risk stratification information for patients with sepsis at different pathophysiological stages.
In terms of clinical utility, IG% has unparalleled advantages. As a direct output parameter of the routine complete blood count (CBC) from modern automated hematology analyzers (e.g., the Sysmex series), obtaining the IG% requires no additional blood draws, no special reagents, and virtually no extra medical costs, with results reported within minutes [12]. Compared to biomarkers like procalcitonin (PCT), which require separate, more costly testing, IG% is not only comparable in diagnostic efficacy but may also be more sensitive in monitoring early inflammatory fluctuations during antibiotic therapy [27]. Therefore, IG% has the potential to serve as a highly cost-effective “add-on” risk assessment tool in routine ICU practice.
Strengths and Limitations
This study has several notable strengths. First, the extremely large sample size (4,611 cases) from the MIMIC-IV database far exceeds that of most previous single-center cohort studies, greatly enhancing the statistical power and generalizability of the conclusions. Second, through multivariate Cox models and subgroup analyses, a vast array of known demographic and clinical confounders were adjusted for, ensuring the reliability of the independent prognostic value of IG%. Finally, the RCS model clarified the linear relationship between IG% and mortality risk, providing a reference for establishing interventional cut-off values in future clinical practice.
However, this study also has certain limitations. First, single-center bias: all patients in the MIMIC IV database were from a single medical center in Boston, USA (BIDMC). The ICU admission criteria, population characteristics, and treatment protocols may differ from those in other regions or countries, somewhat limiting the external validity of the findings. Second, instrument heterogeneity: the MIMIC-IV data span over a decade (2008–2019), during which the automated hematology analyzers used by the hospital may have been upgraded. Minor differences in the algorithms used by different devices to identify immature granulocytes could introduce measurement bias [12]. Third, the dynamic impact of therapeutic interventions was not fully evaluated: this study only extracted the first IG% value upon ICU admission and did not dynamically assess the impact of key treatments, such as the timing of antibiotic administration and fluid resuscitation strategies, on the trajectory of IG% and ultimate mortality. Fourth, as a retrospective observational study, it is impossible to completely rule out unmeasured residual confounders (such as specific pathogen types) or to establish a direct causal relationship between elevated IG% and death. Future multi-center, prospective cohort studies are needed to further validate the clinical value of IG% and explore the role of its dynamic changes in monitoring therapeutic efficacy.
CONCLUSIONS
This study demonstrates that an elevated peripheral blood immature granulocyte percentage (IG%) upon ICU admission is independently and significantly associated with an increased risk of short- and long term mortality in patients with sepsis. This association is independent of traditional prognostic indicators such as the SOFA score and lactate levels. As a rapid, cost-free, and easily accessible routine hematological parameter, IG% provides unique incremental value in reflecting early bone marrow stress and the immunosuppressive state in sepsis. Incorporating IG% into routine monitoring and risk stratification systems for critically ill patients can assist clinicians in the early identification of high-risk individuals, allowing for the timely optimization of individualized treatment strategies and, ultimately, the improvement of clinical outcomes in sepsis.
DECLARATIONS
Ethics approval and consent to participate
The data for this study were extracted from the Medical Information Mart for Intensive Care IV (MIMIC-IV) database. The establishment of the MIMIC IV database was approved by the Institutional Review Boards of the Massachusetts Institute of Technology (Cambridge, MA, USA) and Beth Israel Deaconess Medical Center (Boston, MA, USA). As the database contains only de-identified health information, the requirement for individual patient consent was waived.
Availability of data and materials
The datasets analyzed during the current study are available in the MIMIC-IV database repository (https://mimic.mit.edu/). Access to the database requires completion of the required training courses and approval from the credentialing committee.
Authors’ contributions
ZZ and YX conceptualized the study and designed the methodology. ZZ extracted and analyzed the data. YX contributed to the interpretation of the results. ZZ drafted the initial manuscript. Both authors critically revised the manuscript for important intellectual content and approved the final version for submission.
Acknowledgements
We thank the team at the Laboratory for Computational Physiology at the Massachusetts Institute of Technology for developing and maintaining the MIMIC-IV database.
How to Cite
References
URL: https://pubmed.ncbi.nlm.nih.gov/26903338/
URL: https://pubmed.ncbi.nlm.nih.gov/31954465/
URL: https://pubmed.ncbi.nlm.nih.gov/32572531/
URL: https://pubmed.ncbi.nlm.nih.gov/30243300/
URL: https://pubmed.ncbi.nlm.nih.gov/24286072/
URL: https://pubmed.ncbi.nlm.nih.gov/11904651/
URL: https://pubmed.ncbi.nlm.nih.gov/23398965/
URL: https://pubmed.ncbi.nlm.nih.gov/24751955/
URL: https://pubmed.ncbi.nlm.nih.gov/37095375/
URL: https://pubmed.ncbi.nlm.nih.gov/24942511/
URL: https://pubmed.ncbi.nlm.nih.gov/24942511/
URL: https://pubmed.ncbi.nlm.nih.gov/14608908/
URL: https://pubmed.ncbi.nlm.nih.gov/36453788/
URL: https://pubmed.ncbi.nlm.nih.gov/33533745/
URL: https://pubmed.ncbi.nlm.nih.gov/35436073/
URL: https://pubmed.ncbi.nlm.nih.gov/30689873/
URL: https://www.ovid.com/jnls/bjoa/fulltext/10.4103/bjoa.bjoa_114_20~immature-granulocyte-and-mean-platelet-volume-as-a-predictor
URL: https://pubmed.ncbi.nlm.nih.gov/25342241/
URL: https://pubmed.ncbi.nlm.nih.gov/40269682/
URL: https://pubmed.ncbi.nlm.nih.gov/36596836/
URL: https://pubmed.ncbi.nlm.nih.gov/36148240/
URL: https://pubmed.ncbi.nlm.nih.gov/24942511/
URL: https://pubmed.ncbi.nlm.nih.gov/32803866/
URL: https://link.springer.com/article/10.1186/1471-2172-14-8
URL: https://pubmed.ncbi.nlm.nih.gov/40961067/
URL: https://link.springer.com/article/10.1186/s12871-025-03072-4